Quantifying decentralization
https://news.earn.com/quantifying-decentralization-e39db233c28e
Balaji Srinivasan, Jul 2017
We must be able to measure blockchain decentralization before we can improve it.
The primary advantage of Bitcoin and Ethereum over their legacy alternatives is widely understood to be decentralization. However, despite the widely acknowledged importance of this property, most discussion on the topic lacks quantification. If we could agree upon a quantitative measure, it would allow us to:
Measure the extent of a given system’s decentralization
Determine how much a given system modification improves or reduces decentralization
Design optimization algorithms and architectures to maximize decentralization
In this post we propose the minimum Nakamoto coefficient as a simple, quantitative measure of a system’s decentralization, motivated by the well-known Gini coefficient and Lorenz curve.
The basic idea is to (a) enumerate the essential subsystems of a decentralized system, (b) determine how many entities one would need to be compromised to control each subsystem, and (c) then use the minimum of these as a measure of the effective decentralization of the system. The higher the value of this minimum Nakamoto coefficient, the more decentralized the system is.
To motivate this definition, we begin by giving some background on the related concepts of the Gini coefficient and Lorenz curve, and then display some graphs and calculations to look at the current state of centralization in the cryptocurrency ecosystem as a whole according to these measures. We then discuss the concept of measuring decentralization as an aggregate measure over the essential subsystems of Bitcoin and Ethereum. We conclude by defining the minimum Nakamoto coefficient as a proposed measure of system-wide decentralization, and discuss ways to improve this coefficient.
The Lorenz Curve and the Gini Coefficient
Even though they are typically concerns of different political factions, there are striking similarities between the concepts of “too much inequality” and “too much centralization”. Specifically, we can think of a non-uniform distribution of wealth as highly unequal and a non-uniform distribution of power as highly centralized.
Economists have long employed two tools for measuring non-uniformity within a population: the Lorenz curve and the Gini coefficient. The basic concept of the Lorenz curve is illustrated in the figure below:
The Lorenz curve is shown in red above. As the cumulative distribution diverges from a straight line, the Gini coefficient (G) increases from 0 to 1. Figure from Matthew John.

The equation for the Gini coefficient can be calculated from the areas under the Lorenz curve and the so-called “Line of Equality” as shown below:
The Lorenz Curve and the Gini Coefficient.
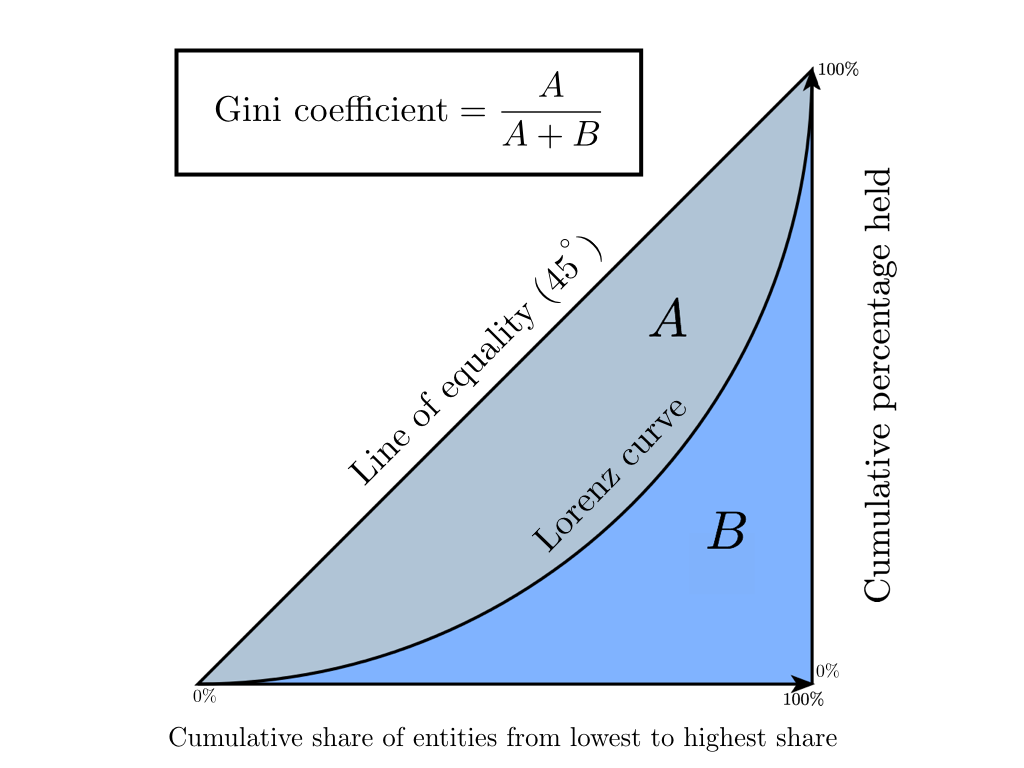
The coefficient can also be calculated from the individual shares of entities for both continuous and discrete distributions (see here for equations).
Intuitively, the more uniform the distribution of resources, the closer the Gini coefficient is to zero. Conversely, the more skewed to one party the distribution of resources, the closer the Gini coefficient is to one.
This captures our intuitive notions of centralization: in a highly centralized system with G=1, there is one decision maker and/or one entity to capture in order to compromise the system. Conversely, in a highly decentralized system with G=0, there are a multiplicity of decision makers who need to be captured in order to compromise the system. Hence, a low Gini coefficient means a high degree of decentralization.
Cryptocurrency: Gini Coefficients and Lorenz Curves
To build intuition, let’s look at the Lorenz curve and Gini coefficient for a simple example: the distribution of wealth across cryptocurrency market capitalizations. To do this, we took a snapshot of market capitalizations on July 15 2017 for the top 100 digital currencies, calculated the percentage of market share for each, and graphed it as a Lorenz curve with associated Gini coefficient:
Source: https://coinmarketcap.com/
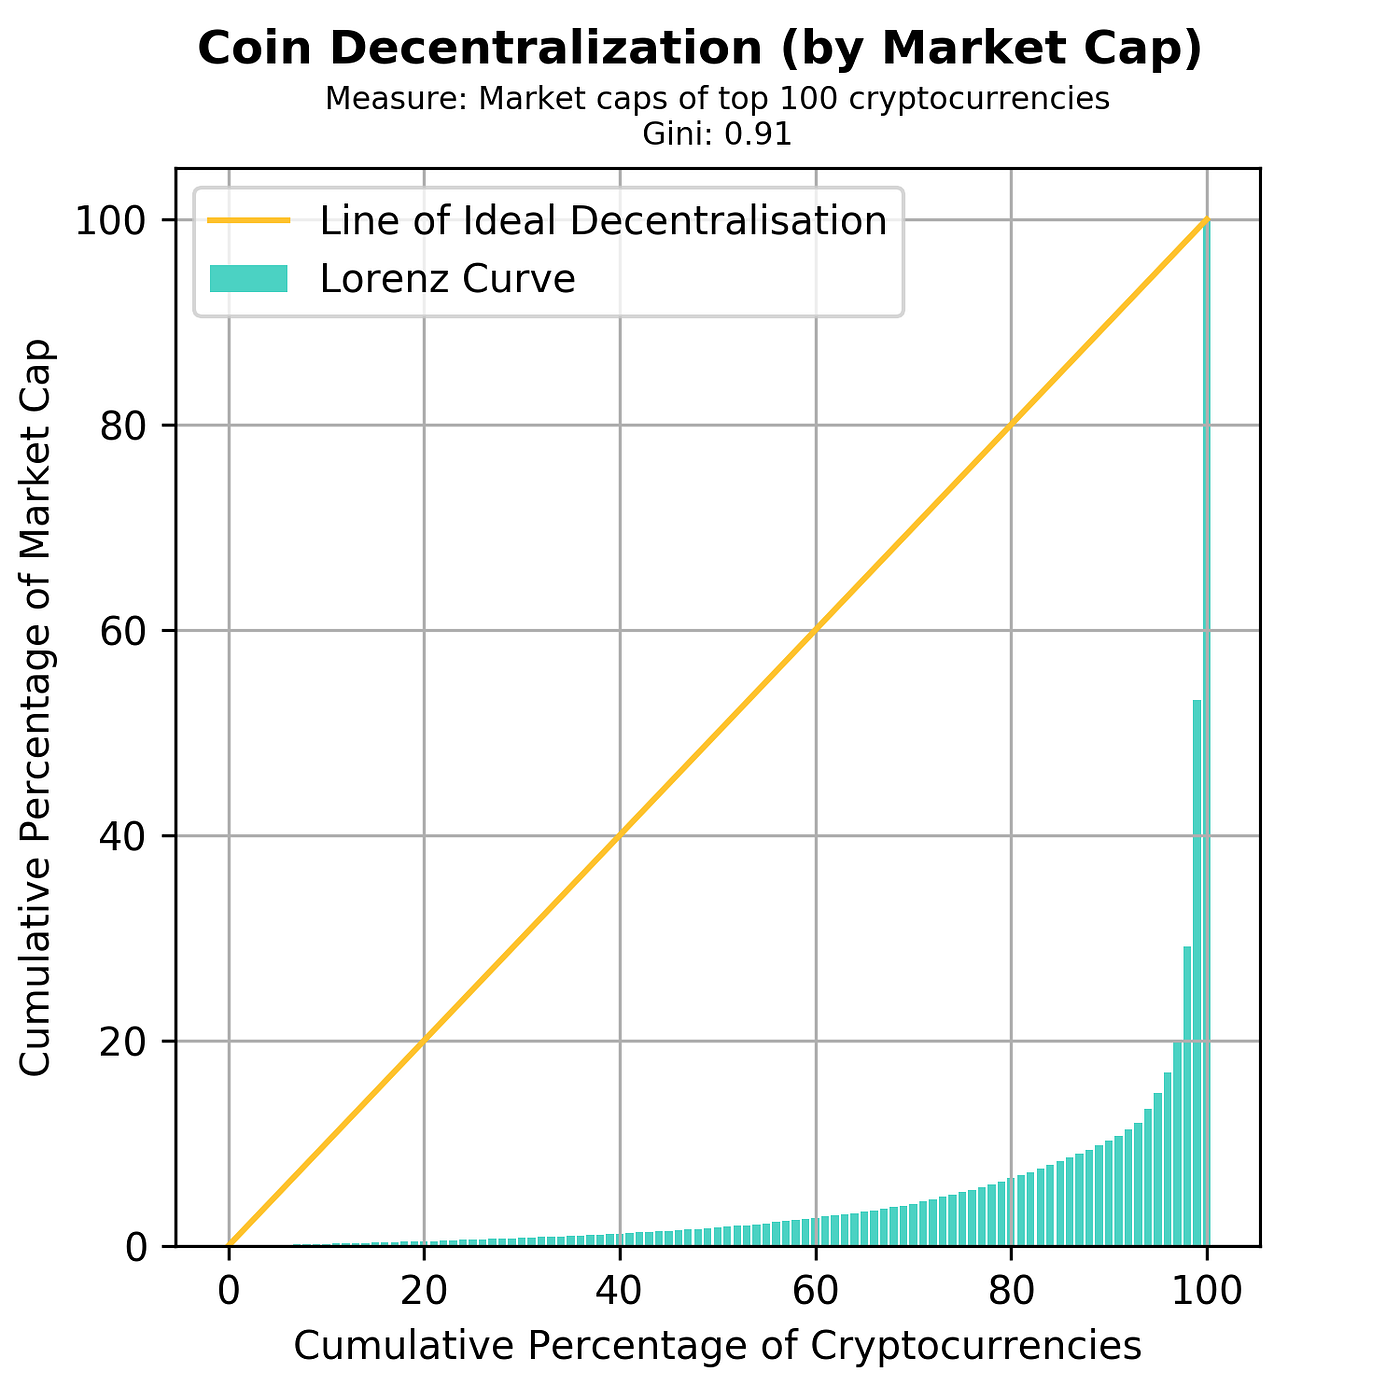
If we measure the centralization of market capitalization across the top 100 cryptocurrencies, the Gini coefficient is 0.91. This fits our intuition as about 70% of the market capitalization as of July 2017 is held by the top two cryptocurrencies, namely Bitcoin and Ethereum.
Decentralized Systems are Composed of Subsystems
To apply this concept to the space of public blockchains, we need to make a distinction between a decentralized system and a decentralized subsystem. Specifically, a decentralized system (like Bitcoin) is composed of a set of decentralized subsystems (like mining, exchanges, nodes, developers, clients, and so on). Here are six of the subsystems that compose Bitcoin:
We will use these six subsystems to illustrate how to measure the decentralization of Bitcoin or Ethereum. Please note: you may decide to use different subsystems based on which ones you consider essential to decentralization of the system as a whole.
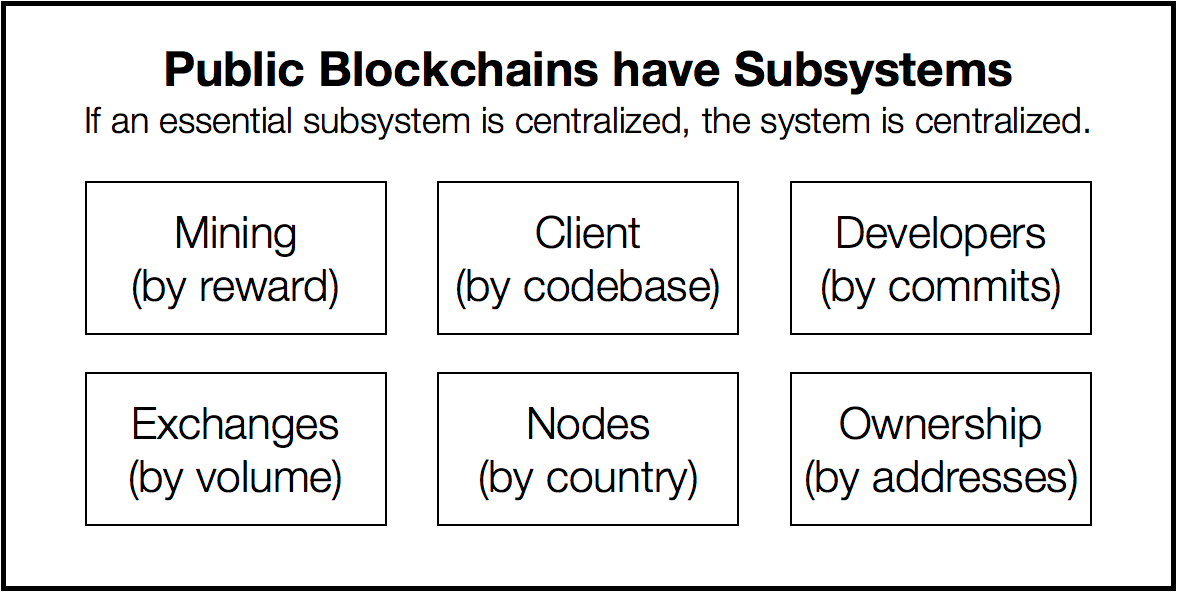
Now, one can argue that some of these decentralized subsystems may be more essential than others; for example, mining is absolutely required for Bitcoin to function, whereas exchanges (as important as they are) are not actually part of the Bitcoin protocol.
Let’s assume however that a given individual can draw a line that identifies the essential decentralized subsystems of a decentralized system. We can then stipulate that one can compromise a decentralized system if one can compromise any of its essential decentralized subsystems.
Quantifying Bitcoin and Ethereum Decentralization
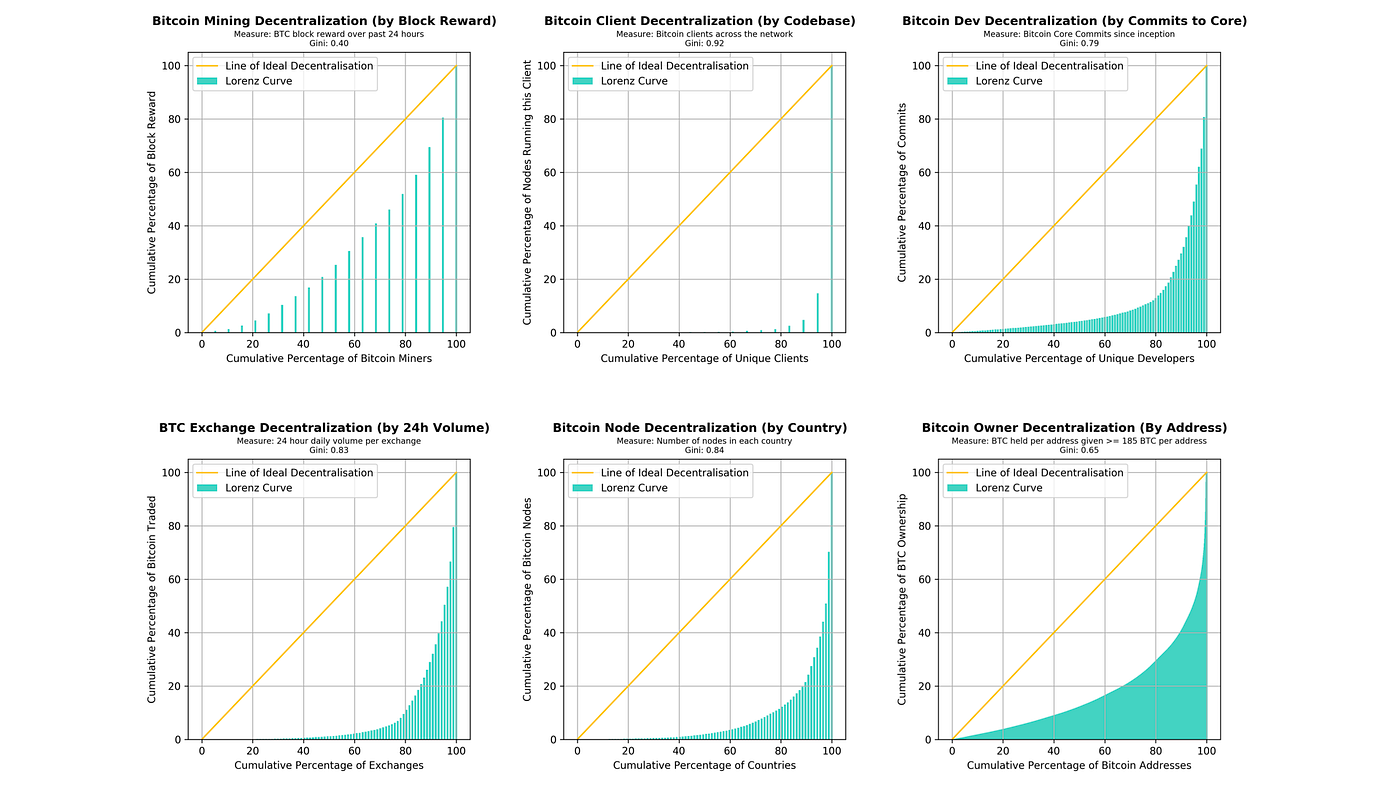
Given these definitions, let’s now calculate Lorenz curves and Gini coefficients for the Bitcoin and Ethereum mining, client, developer, exchange, node, and owner subsystems. We can see how centralized each of them are according to the Gini coefficient and Lorenz curve measures.
Here are the curves for Bitcoin:
And here they are for Ethereum:
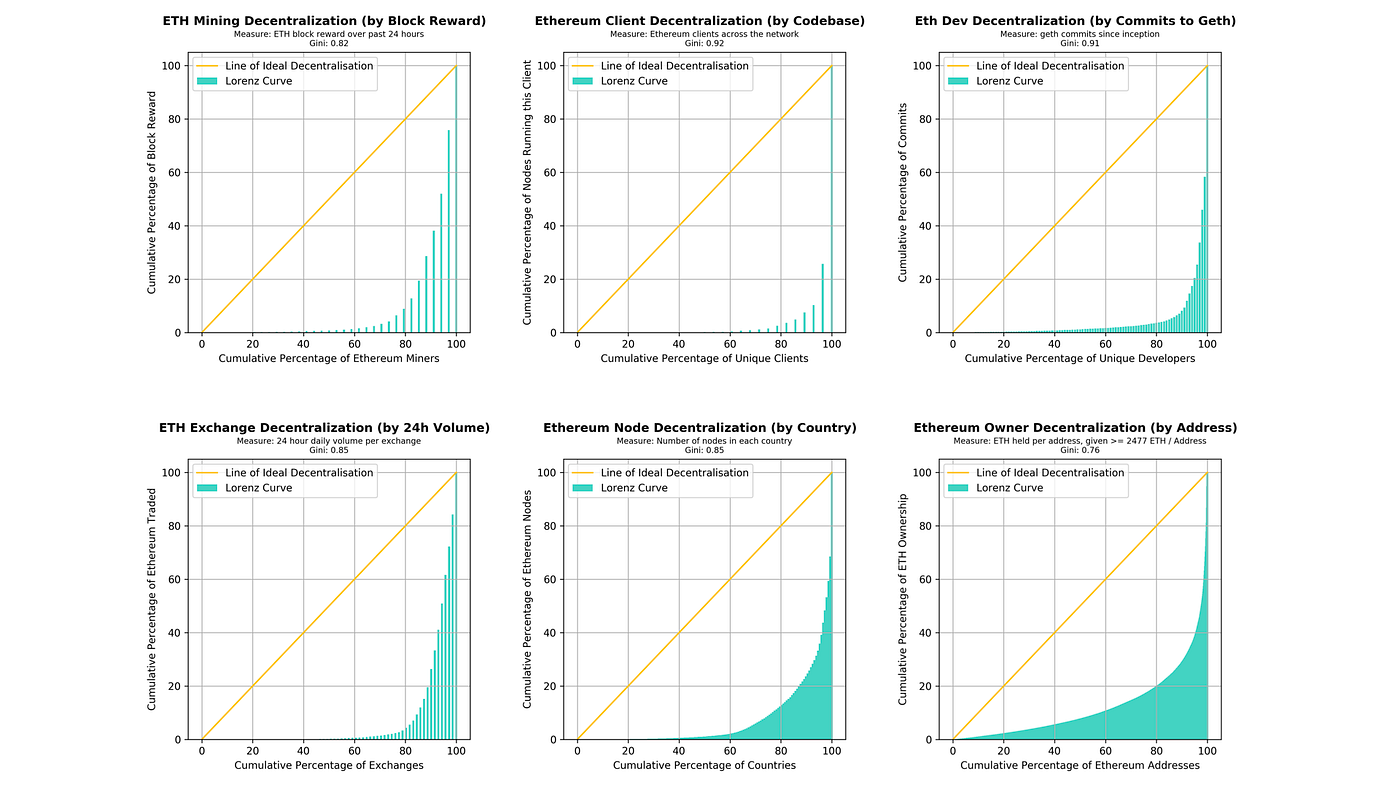
Let’s discuss each of these subsystems in turn by reference to the six panels in each of the figures above.
Mining Decentralization
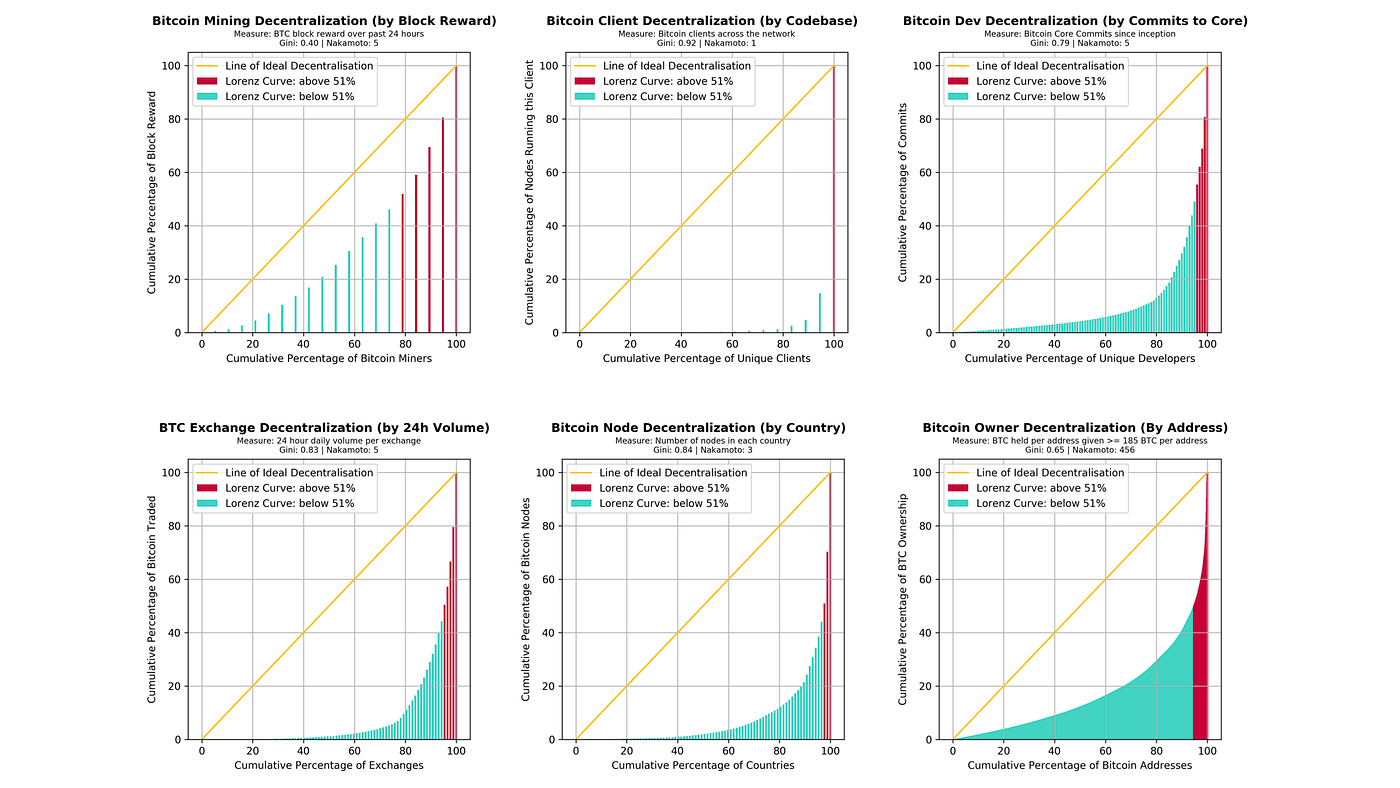
As shown in the top left panel of the figures, Bitcoin mining is surprisingly decentralized as measured by block reward over the past 24 hours. Ethereum mining is somewhat more centralized. There is fairly high variance in these value, so we can track it over time or smooth the result by taking a 7 or 30 day average.
Client Decentralization
As seen in the top middle panel of each figure, Most Bitcoin users use Bitcoin Core, with Bitcoin Unlimited being the second most popular client. This means a fairly high degree of centralization (Gini = 0.92) as measured by the number of different client codebases. For Ethereum clients by codebase, most of the clients (76%) run geth, and another 16% run Parity, which also gives a Gini coefficient of 0.92 as two codebases account for most of the ecosystem.
Dev Decentralization
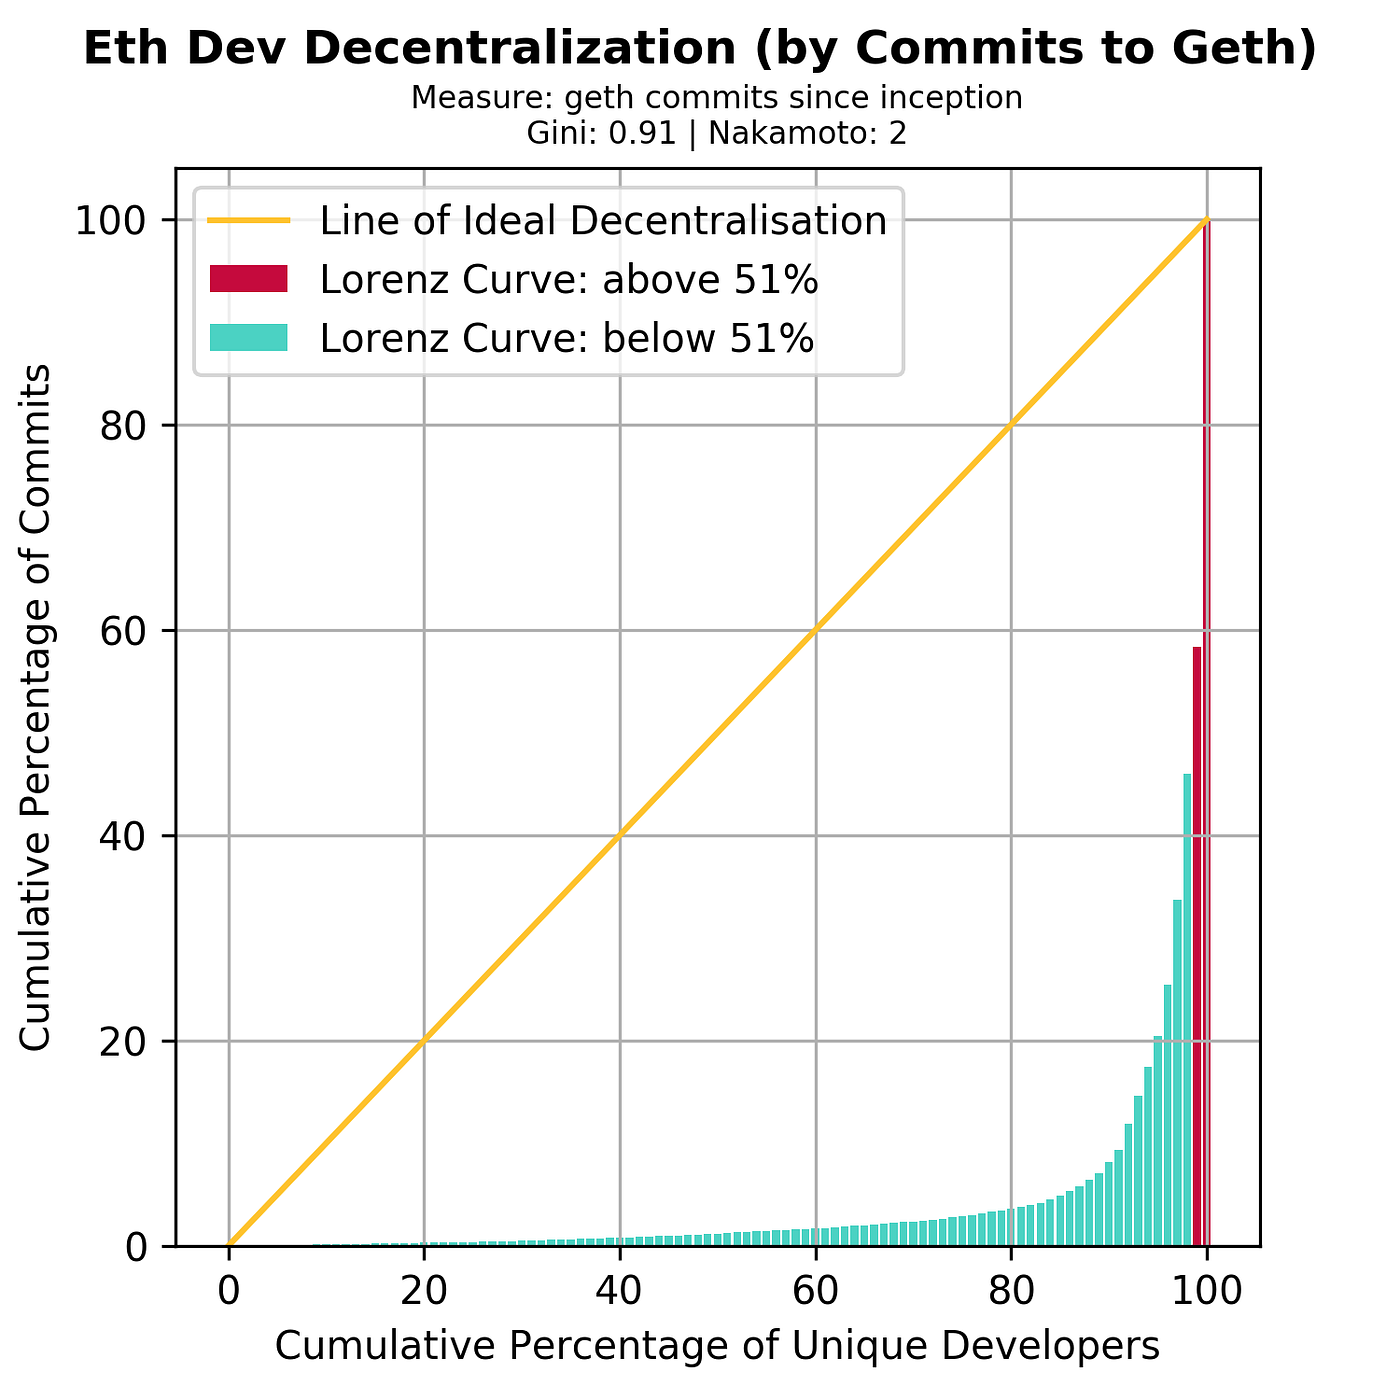
In the top right panel, we can see that the Bitcoin Core reference client has a number of engineers who have made commits. Though raw commits are certainly an imprecise measure of contribution, directionally it appears that a relatively small number of engineers have done most of the work on Bitcoin Core. For the geth reference client of Ethereum, development is even more concentrated, with two developers doing the lion’s share of commits.
Exchange Decentralization
The volume of Bitcoin and Ethereum traded across exchanges varies a great deal, as do the corresponding Gini coefficients. But we calculated snapshots of the Gini coefficient over the past 24 hours for illustrative purposes in the bottom left panels.
Node Decentralization
Another measure of decentralization (bottom middle panels) is to determine what the node distribution is across countries for Bitcoin and Ethereum.
Ownership Decentralization
In the last panels in the lower right, we look at how decentralized Bitcoin and Ethereum ownership is, as measured by addresses. One important point: if we actually include all 7 billion people on the earth, most of whom have zero BTC or Ethereum, the Gini coefficient is essentially 0.99+. And if we just include all balances, we include many dust balances which would again put the Gini coefficient at 0.99+. Thus, we need some kind of threshold here. The imperfect threshold we picked was the Gini coefficient among accounts with ≥185 BTC per address, and ≥2477 ETH per address. So this is the distribution of ownership among the Bitcoin and Ethereum rich with >$500k as of July 2017.
In what kind of situation would a thresholded metric like this be interesting? Perhaps in a scenario similar to the ongoing IRS Coinbase issue, where the IRS is seeking information on all holders with balances >$20,000. Conceptualized in terms of an attack, a high Gini coefficient would mean that a government would only need to round up a few large holders in order to acquire a large percentage of outstanding cryptocurrency — and with it the ability to tank the price.
With that said, two points. First, while one would not want a Gini coefficient of exactly 1.0 for BTC or ETH (as then only one person would have all of the digital currency, and no one would have an incentive to help boost the network), in practice it appears that a very high level of wealth centralization is still compatible with the operation of a decentralized protocol. Second, as we show below, we think the Nakamoto coefficient is a better metric than the Gini coefficient for measuring holder concentration in particular as it obviates the issue of arbitrarily choosing a threshold.
Maximum Gini Coefficient: A Crude Measure of Blockchain Decentralization
Can we combine these sample measures of subsystem decentralization into a measure of system decentralization? A simple first approach would simply be to take the maximum Gini coefficient over all essential subsystems, as shown below:
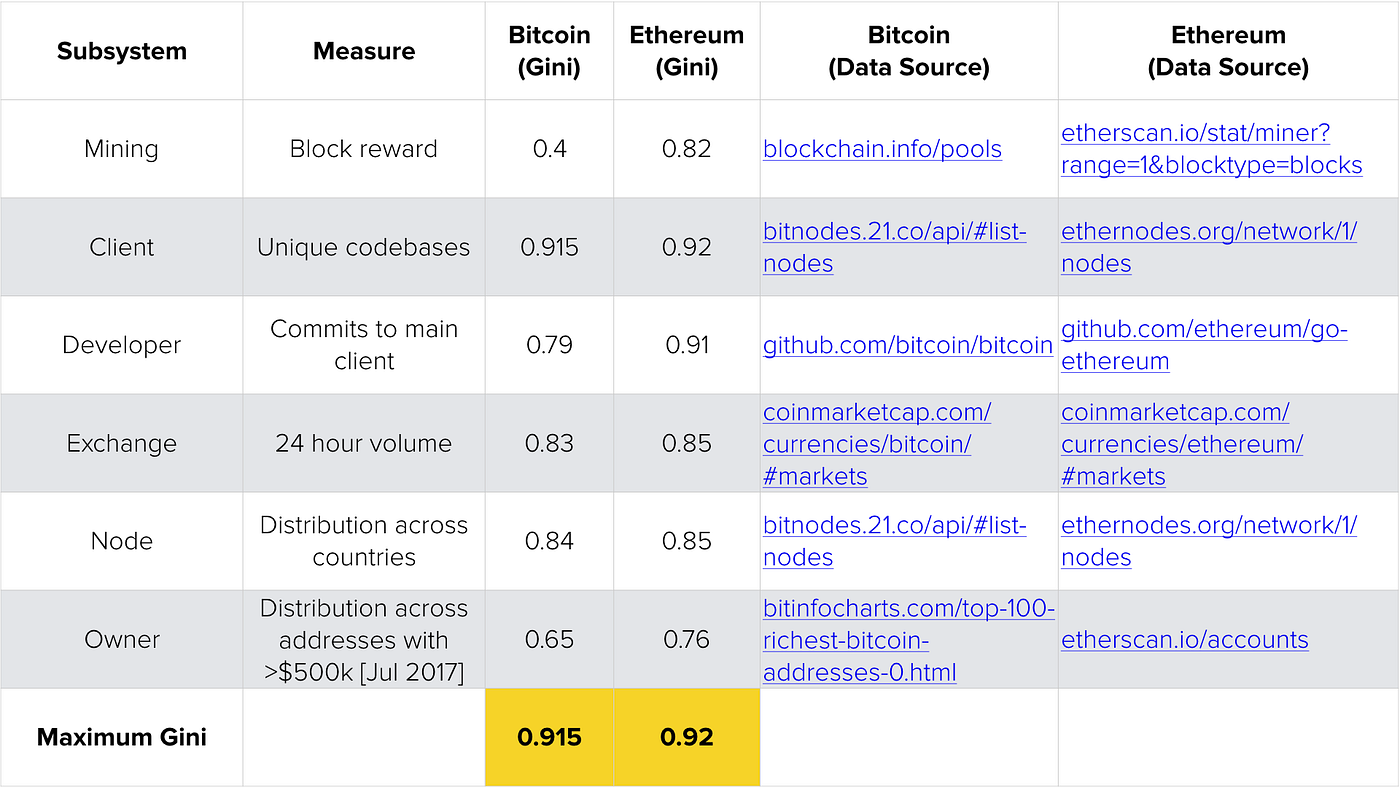
So, by this measure, both Bitcoin and Ethereum have a maximum Gini Coefficient of ~0.92, because both of them have nodes with clients that are very highly concentrated in one codebase (Bitcoin Core for Bitcoin, and geth for Ethereum).
Crucially, a different choice of essential subsystems will change these values. For example, one may believe that the presence of a single codebase is not an impediment toward practical decentralization. If so, then Bitcoin’s maximum Gini coefficient would improve to 0.84, and the new decentralization bottleneck would be the node distribution across countries.
We certainly don’t argue that the particular choice of six subsystems here is the perfect one for measuring decentralization; we just wanted to gather some data to show what this kind of calculation would look like. We do argue that the maximum Gini coefficient metric starts to point in the right direction of identifying possible decentralization bottlenecks.
Minimum Nakamoto Coefficient: An Improved Measure of Blockchain Decentralization
However, the maximum Gini coefficient has one obvious issue: while a high value tracks with our intuitive notion of a “more centralized” system, the fact that each Gini coefficient is restricted to a 0–1 scale means that it does not directly measure the number of individuals or entities required to compromise a system.
Specifically, for a given blockchain suppose you have a subsystem of exchanges with 1000 actors with a Gini coefficient of 0.8, and another subsystem of 10 miners with a Gini coefficient of 0.7. It may turn out that compromising only 3 miners rather than 57 exchanges may be sufficient to compromise this system, which would mean the maximum Gini coefficient would have pointed to exchanges rather than miners as the decentralization bottleneck.
There are various ways to surmount this difficulty. For example, we might be able to come up with principled weights for the Gini coefficients of different subsystems prior to combining them.
An alternative approach is to define a spiritually similar metric based on the Lorenz curve from which the Gini coefficient is calculated, which we dub the “Nakamoto coefficient”. A visual is below. In this example, the Nakamoto coefficient of the given subsystem is 8, as it would require 8 entities to get to 51% control.
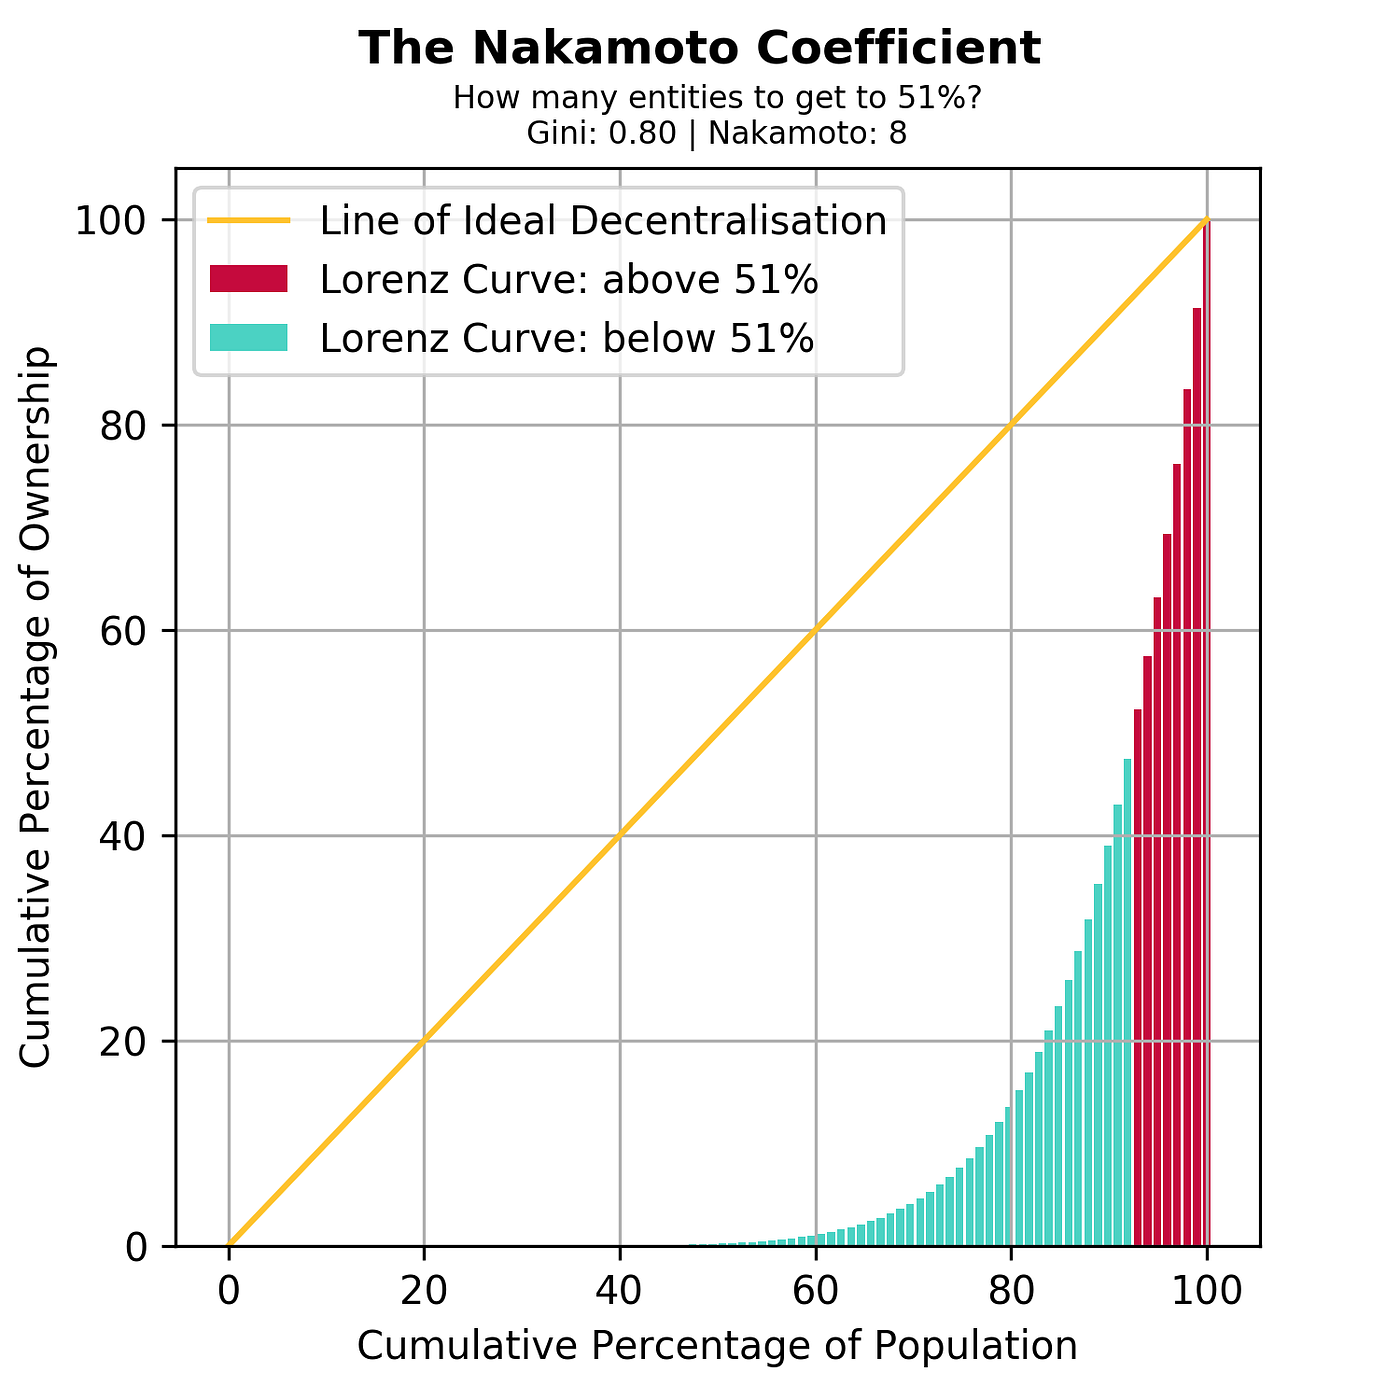
That is, we define the Nakamoto coefficient as the minimum number of entities in a given subsystem required to get to 51% of the total capacity. Aggregating this measure by taking the minimum of the minimum across subsystems then gives us the “minimum Nakamoto coefficient”, which is the number of entities we need to compromise in order to compromise the system as a whole.
The Nakamoto coefficient represents the minimum number of entities to compromise a given subsystem. The minimum Nakamoto coefficient is the minimum of the Nakamoto coefficients over all subsystems.
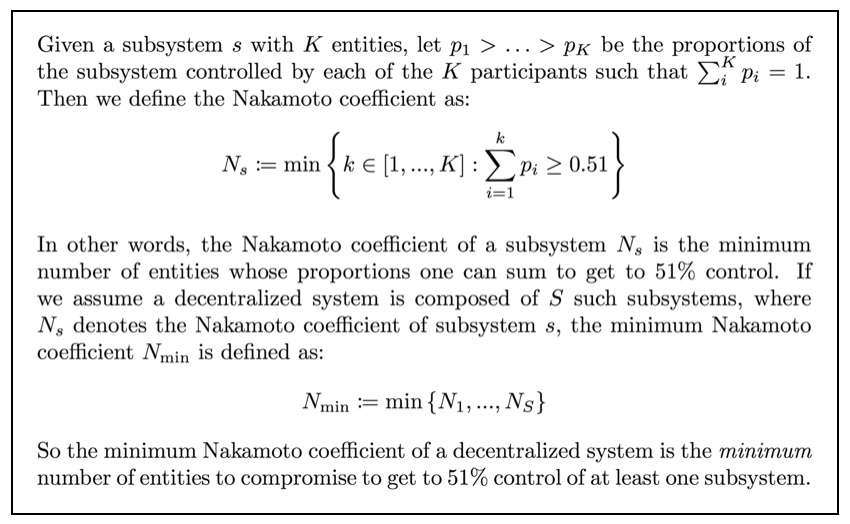
We can also define a “modified Nakamoto coefficient” if 51% is not the operative threshold across each subsystem. For example, perhaps one might require 75% of exchanges to be compromised in order to seriously degrade the system, but only 51% of miners.
We can now use the Lorenz curves from the preceding section to calculate the Nakamoto coefficients for both Ethereum and Bitcoin. Here’s an example of the calculation for Ethereum’s reference client, geth. As we can see, with 2 developers we get to 51% of the commits to geth, so the Nakamoto coefficient is 2.
That illustrates the concept. Here are graphs for all of the subsystems for Bitcoin and Ethereum again, this time with the Nakamoto coefficients calculated:
And here’s a table where we’ve assembled the Nakamoto coefficients of each subsystem:
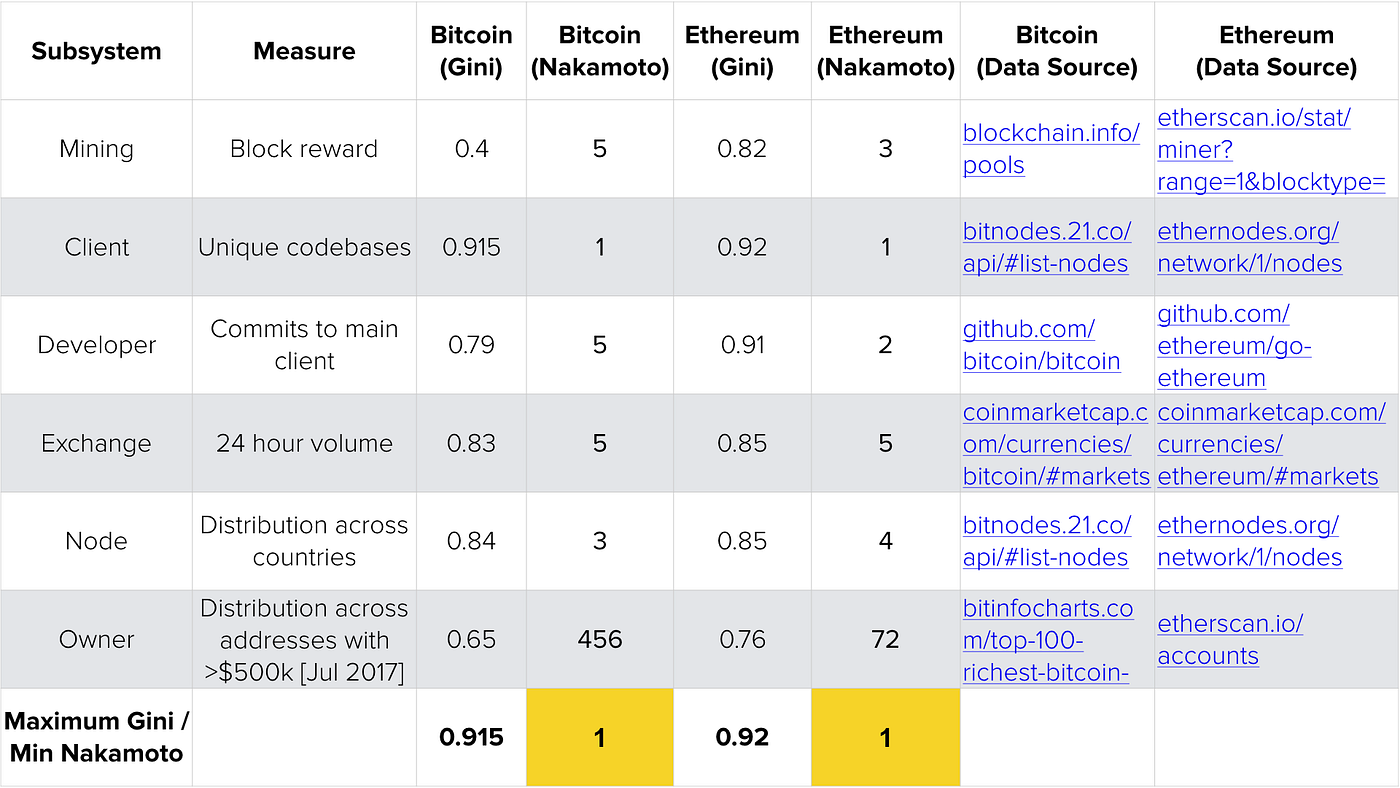
As we can see, given these essential subsystems, we can say that the Nakamoto coefficient is 1 for both Bitcoin and Ethereum. Specifically, the compromise of the Bitcoin Core or geth codebases would compromise more than 51% of clients, which would result in compromise of their respective networks.
Increasing this for Ethereum would mean achieving a much higher market share for non-geth clients like Parity, after which point developer or mining centralization would become the next bottleneck. Increasing this for Bitcoin would similarly require widespread adoption of clients like btcd, bcoin, and the like.
The Minimum Nakamoto Coefficient depends on Subsystem Definitions
We recognize that some may contend that a high level of concentration in a single reference client for Bitcoin does not impinge upon its decentralization, or that this level of concentration is a necessary evil. We take no position on this issue, because with alternate essential subsystem definitions, one can arrive at different measures of decentralization.
For example, if one considers “founder and spokesman” an essential subsystem, then the minimum Nakamoto coefficient for Ethereum would trivially be 1, as the compromise of Vitalik Buterin would compromise Ethereum.
Conversely, if one considers “number of distinct countries with substantial mining capacity” an essential subsystem, then the minimum Nakamoto coefficient for Bitcoin would again be 1, as the compromise of China (in the sense of a Chinese government crackdown on mining) would result in >51% of mining being compromised.
The selection of which essential subsystems best represent a particular decentralized system will be a topic of some debate that we consider outside the scope of this post. However, it is worth observing that the “founder and spokesman” and “China miner” compromises are two different kinds of attacks for two different chains. As such, if one thinks about comparing the minimum Nakamoto coefficient across coins, some degree of ecosystem diversity may quantitatively improve decentralization.
Conclusion
Many have said that decentralization is the most important property of systems like Bitcoin and Ethereum. If this is true, then it is critical to be able to quantify decentralization. The minimum Nakamoto coefficient is one such measure; as it increases, the minimum number of entities required to compromise the system increases. We believe this corresponds to the intuitive notion of decentralization.
The reason an explicit measure for quantifying decentralization is important is three-fold.
Measurement. First, quantitative measures like this can be computed unambiguously, recorded over time, and displayed in dashboards. This gives us the ability to track historical trends toward decentralization within subsystems and at the system level.
Improvement. Second, just like we measure performance, a measure like the Nakamoto coefficient allows us to begin measuring improvements and/or reductions of decentralization. This then allows us to begin attributing changes in decentralization to individual deployments of code or other kinds of network activities. For example, given scarce resources, we can measure whether deploying 1000 nodes or hiring two new client developers would provide a greater improvement in decentralization.
Optimization. Finally, and most importantly, a quantifiable objective function (in the mathematical sense) determines the outcome of any optimization procedure. Superficially similar objective functions can produce very different solutions. If our goal is to optimize the level of decentralization both across and within decentralized systems, we are going to need quantitative metrics like the Lorenz curve, the Gini coefficient, and the Nakamoto coefficient.
We recognize that there is plenty of room for debate over which subsystems of a decentralized system are essential. However, given a proposed essential subsystem we can now generate a Lorenz curve and a Nakamoto coefficient, and see whether this is plausibly a decentralization bottleneck for the system as a whole.
As such, we think the minimum Nakamoto coefficient is a useful first step towards quantifying decentralization.
Last updated